In my previous post I introduce you to some tools that you can use in your stock picking and one of them is APF Trading's Expert Stock Screener.(Click here for a sample of Expert Stock Screener)
Basically it is the condensed report of some listed stock of a certain stock market(I'll be using The Philippine Stock Exchange as my example) based on reports and analysis of various broker and analyst taking into consideration both fundamental and technical analysis.
So how do really use this tool anyways?
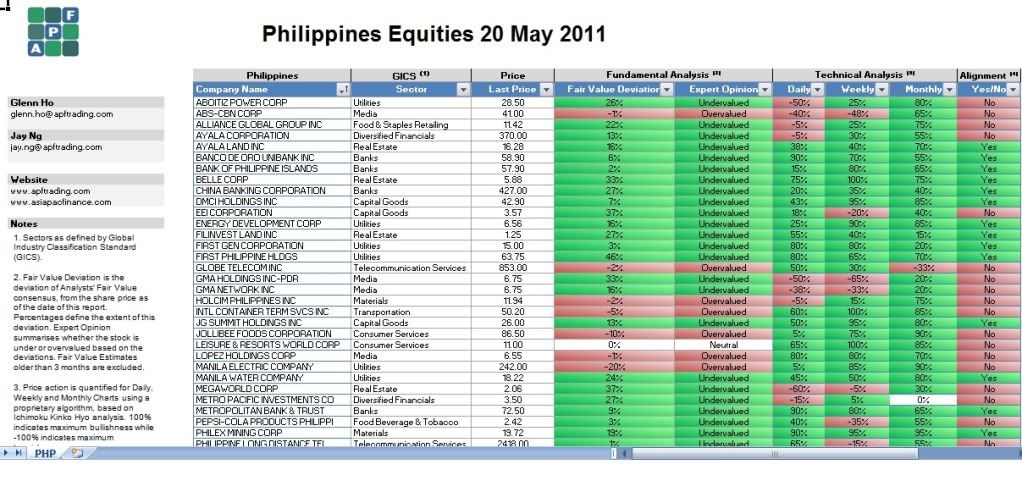
First of all it is a report in an excel format thus where there is excel this is a filter function. In the far right of the report there is a column with a heading of ALIGNMENT. Click the dropdown arrow and unmark everything and then mark "YES" to filter stocks with an alignment status meaning the Fundamental and Technical analysis aligned as per APF Tradings criteria.
Then from the filtered list you can chose which stocks to pick up for a buy or for a sell. You can further filter the selection by adding another filter.
You can either use the FAIR VALUE DEVIATION as your criteria of a buy consideration. The stock with the highest value means that the various analyst value the stock higher than its current price. What does this mean. Let use FPH(First Philippine Holdings) as an example. FPH has price on May 20, 2011 at 63.75 pesos/share with a FV deviation of 46% this means that the analyst has a target price of 93.075 pesos/share. This is the fundamental side of the analysis. Various analyst have different criteria and methods of determining Target Price but it all boils down to the company's financials taking into consideration future cashflows anf profitability.
After determining the Target Price the next question one has is when to buy FPH. This is a hard question to answer because remember the truth about the stock market:NOBODY CAN ACCURATE PREDICT WHEN WILL THE STOCK BE UP OR DOWN ONLY A PROBABLE TREND CAN BE MADE.
With that in mind one can turn to the Technical analysis columns DAILY, WEEKLY, and MONTHLY. These columns indicate the bullishness of the stock(when it is positive) or bearishness(when it is negative) On this columns we can make to guidelines.
1. Buy when the stock is at its bottom and about to go north
2. Sell once the stock's price starts to fall
The two above rule are basics of the Demand and Supply Law.
It is a common mistake of small and newbie investors to buy when the stock has already gone halfway its upward trend as well as when the stock is still going down. Though it is always a premise that there is no wrong timing in the stock market it could have been profitable when you are able to buy the stock at a very cheap price and sell it at a high price.
By comparing the Daily, Weekly, and Monthly bullishness indicator you can determine where is the start of the stocks upward price point; that is the point in which you start to accumulate until it goes up more and breakout from its resistance level.
I guess those are the basics in using APF Trading's Expert Stock Screener. If you are interested or want to learn more about APF Trading Expert Stock Screener click here
3 comments:
What scholastic article...
I notice of what's been analyze by that tool on in the Ayala Land [on your provided screenshot], and upon seeing it and compared on the history, it shows that Ayala land is been loss a lot of percentage during those period. It means the expert stock screening is not accurate? Can you provide other sample report pls. Thanks :)
Hi Sonia Trevor! The data on the article has been from an old data and it could have change already since then.
Post a Comment