Investing in Philippines: stock

SEARCH INVESTING IN PHILIPPINES

Showing posts with label stock. Show all posts

Tuesday, September 6, 2011

Technical side: Chart Patters what are they?

source: http://www.chartpatterns.com/


Here is what Investopedia.com has to say about patterns:

In technical analysis, the distinctive formation created by the movement of security prices on a chart. It is identified by a line connecting common price points (closing prices, highs, lows) over a period of time. Chartists try to identify patterns to try to anticipate the future price direction. Also known as "trading pattern".

So generally chart patterns are formations made by connecting some points of the stock's movement for a period of time. With this definition one chartist may see a different chart pattern from another chartist if they have different time period and different movements as a connecting point.

Chart patterns can be made whether one uses a Candlestick chart, a Bar Chart, or a simple Closing Price Chart. These patterns are not exact and accurate answer to everyone's question if a stock is a buy or a sell but mainly it guides one to at least know what is the probable price action of the stock in the next couple of days base on historical price movement.

Patterns can be classified as Bullish pr Bearish chart patterns. 

source:http://www.torycapital.com

Bullish chart patterns are patterns that signify an upward trend meaning price action is predicted to go up because sellers are pushing the price up and buyers are willing to buy at a higher price believing that stock price are still going up due to an expected market recovery or boom in the economy.

Bearish chart patterns are the opposite of a bullish market. A bearish pattern signify an expected decline in prices brought about by fear of economic downfall or an expected poor economy. Such fear spur panic to investors thus sellers sell down to grab as much profit they can take before market gets stuck. Buyers on the other hand bargain hunt thus they bid for lower prices.

Patterns as well can be viewed as a Reversal or Continuation.

Source: http://tradegartleypattern.blogspot.com/

Reversal patterns indicate a opposite action from what has already been happening in the stock's price. If the stock has been on a downtrend for sometime a reversal pattern will indicate an expected upward thus investors anticipate such reversal and thus buy more of the stock to capitalize on the stocks lower price.
Continuation pattern on the other hand indicates that the stock price will be expected to go up further. With this expectation investors will buy more to ride with the stocks seemingly continuing rise.

Sunday, August 21, 2011

What are Growth Stocks

source: http://www.benzinga.com


Growth stocks are stocks whose earnings are expected to grow at an above-average rate relative to the market. A growth stock usually does not pay a dividend, as the company would prefer to reinvest retained earnings in capital projects.(source: www.investopedia.com)

As the definition above says a Growth Stock is a stock expected to grow at above average as compared to the PSEi so for an example we have PX(Philex Mining Corp.)

source: www.bloomberg.com
The above comparison tells it all. Sometimes growth stock companies don't declare dividends and re-invest earnings to fund expected growth. PX was once expected to slow down when its mine in Padcal, Benguet was said to mine out in the near future about 2012. But the recent findings that such mine will extend for more years geared PX to an expectation of more earnings that it even caught the attention of Manny Pangilinan leading to MPI's(Metro Pacific Investments) entry to PX.

Last year my investor friends and I established a TP(Target Price) of 21 pesos per share for PX when it was in the 12-14 pesos level. But today PX is now at 27 pesos level way above our TP.

With the mining boom expected to come back to the Philippines PX is expected more to rise up from its 27 peso level. Other mining stocks like LC/LCB, AT, and other are expected to peak up as well. When will that be nobody really knows yet but expectation of growth is there thus these stocks are called Growth stocks.

Thursday, July 14, 2011

Simple Stock Estimated Computation Tool

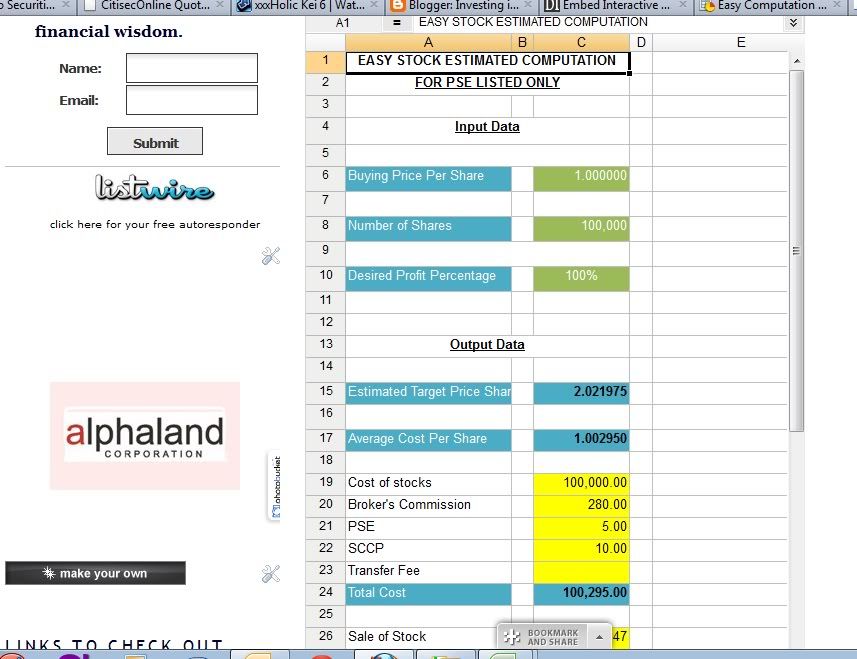
I updated the stock computation tool. With Zoho Sheet I am able to make the Excel editable in the Tool page. 

Click here or go to the Tool Page to check it out. Just click the Click to Edit button to make enter data on the 3 green fields namely Buying Price Per Share, Number of Shares, and Desired Profit Percentage. The rest are with formulas and automatically computed. 

Below is the screenshot of the updated Stock Computation Tool:


I hope this one helps you in your stock investment or trading transactions.

Monday, May 2, 2011

How to read a Price Graph


A stock's price graph is one of the tools a stock trader or investor needs to understand to make that decision to buy or sell.

Price graph is a historical data showing the price movement of a stock. In technical analysis price is the driving factor that makes an investor or trader buy or sell. Stock investors and traders have different techniques in their stock picking. Some buy when the stock price is below their valuation, some buy when the stock is about to go north, and some buy when the stock indicates a downtrend.

You might ask how in the world did they know that? They are able to do that by interpreting the price graph.


Again let me re-iterate that nobody can predict stock movement; only a probable trend can be made based on what is the current market demand-supply level.

Let us use the below price graph and other graph of CHIB as our example.


Most charting software has three to four graphs. The above is take from Citiseconline's charting in there website.


The graphs in the above picture are:
1. Price graph
2. Volume graph
3. MACD
4. Stochastic


Now let us focus on the Price graph


Legend:
SMA3 - Simple Moving Average 130 days
SMA2 - Simple Moving Average 65 days
SMA1 - Simple Moving Average 32 days
CHIB - Stock Code


Simple moving average as the name says is the average price of the stock for the specified number of days. So in the legend SMA1 is nearly the average for a month, SMA2 is for 2 months, and SMA3 is for nearly 5 months.


Why are these important?


These are used as indicator meaning they give an idea where is the direction of the stock. It also defines where are the possible support and resistance. I know these words seems gibberish, click here and here to know more.

Now you know that the 3 SMA's are the average of the stock's price for a certain period, compare such averages to the current price. If the Current price is above all it indicates that the stock going stronger thus it surpasses its average prices. This means the stock's price is trending up thus a good time to profit when you already have the stock. You can hold the stock for a while or as you wait for it to reach your estimated target price(which you can set by using some stock computation tool). Sell when the stock has reached your target price.

On the other when the current price crosses below the averages it means its price is trending down. If you have bought the stock lower than the current price it could be a good chance to take profits. But if you have bought it while it was above the average it is the best time to cost average. 


With this knowledge also remember that you have to verify such price trend. This could be verified in the Volume graph. The volume graph indicates the activeness of the stock. If the current price crosses the averages upward but there is no increase in volume then such movement is not verified thus it could only be that the stock is being played or such price uptrend is just circumstantial.


Other indicators are always included for further verification. MACD or Moving Average Convergence Divergence indicates whether the stock price has a bigger or smaller price change while Stochastic indicates whether the stock is overbought or oversold.

Again nobody can predict the exact movement of the stock; only probable outcomes. The price graph is a guide but no matter what happens it is still your call as an investor or trader to chose sell or buy button.


(I would like to thank my mommy Krissy for the volume verification, Tatay John316 for lessons on when to buy and sell, and Johnny Rocky for his explanation on the moving average)

Sunday, December 26, 2010

Christmas season


We celebrated Christmas yesterday and the PSE has been closed since Dec 24 till Dec 28 in observance of the holidays.

So what have you thought during these days? Most people spend Christmas with parties and buying here and there. There is nothing wrong with enjoying the holidays, the thing is even though it is a once in a year celebration one should always keep in mind one's goals. It is okay to buy gifts as long as it is the thought that counts rather than the monetary value. 

Give gifts of value. 

Something that the person you gave will cherish for a long time and from time to time will look back and remember  and smile.

Most little ones at this time might receive money from their lolo, lola, auntie and uncle. Why not teach them to save up those small monetary gifts from  lolo and tell them that if such is accumulated to at least Php 5,000.00 they can open an online brokerage account at Metrobank and start buying stock with intrinsic value while their young, remember TEL years back was only at 250 per share but now its already at 2400.

But above all remember the reason why we celebrate this event. God loves us that much that He gave His own Son for us. How about you what can you share this Christmas?

We thank you for helping us give some to our poor kababayan in Isabela as well as for the CCVF project. We hope to actively give what ever we can to the least of our brethren if we have some extra. No matter how small it is when we put it together it becomes a bigger chunk.

Give not because you want something in return, give because you want to give. Give without expecting any in return.

Friday, May 14, 2010

Some lessons learn during this Philippine Election


You might wonder why I am writing about the recent 2010 Philippine Election in a blog about stock investing. If you haven't done so check PSE's website for today's(May 13, 2010) uptrend performance here.


If you haven't noticed the Philippine Stock Exchange performance last Tuesday right after the peaceful election, the PSE rose 4% on that day and mind you it is the only bourse or stock market that posted positive in the Asian market. So what is the lesson to be learn here?

One must be aware of the trend. Trend is something that any stock broker or trader should know. Any news either global or local can affect the Philippine Stock Market. For the past two weeks most market were sluggish due to the Greece debt crisis and the Goldman Sach's issue. The PSE as well went with it but this week nearly all market was down except for the Philippines due to the positive results of the 2010 election. I guess investor confidence on Noynoy is good. The stock market was rallying and has posted positive for the 3 days. Even CNBC's Worldwide Exchange TV show  had a interview of a stock analyst from the Philippines saying Noynoys lead has attracted investors due to the confidence they had with him.

Trend means the forecasted eventuality. Thus upon having the election result most stocks went beyond stock analyst target price. So always look for the trend and analyze it carefully. The trend might be tricky sometimes does one has to read and compare so that wise investing decisions can be made.
Photobucket

Chitika